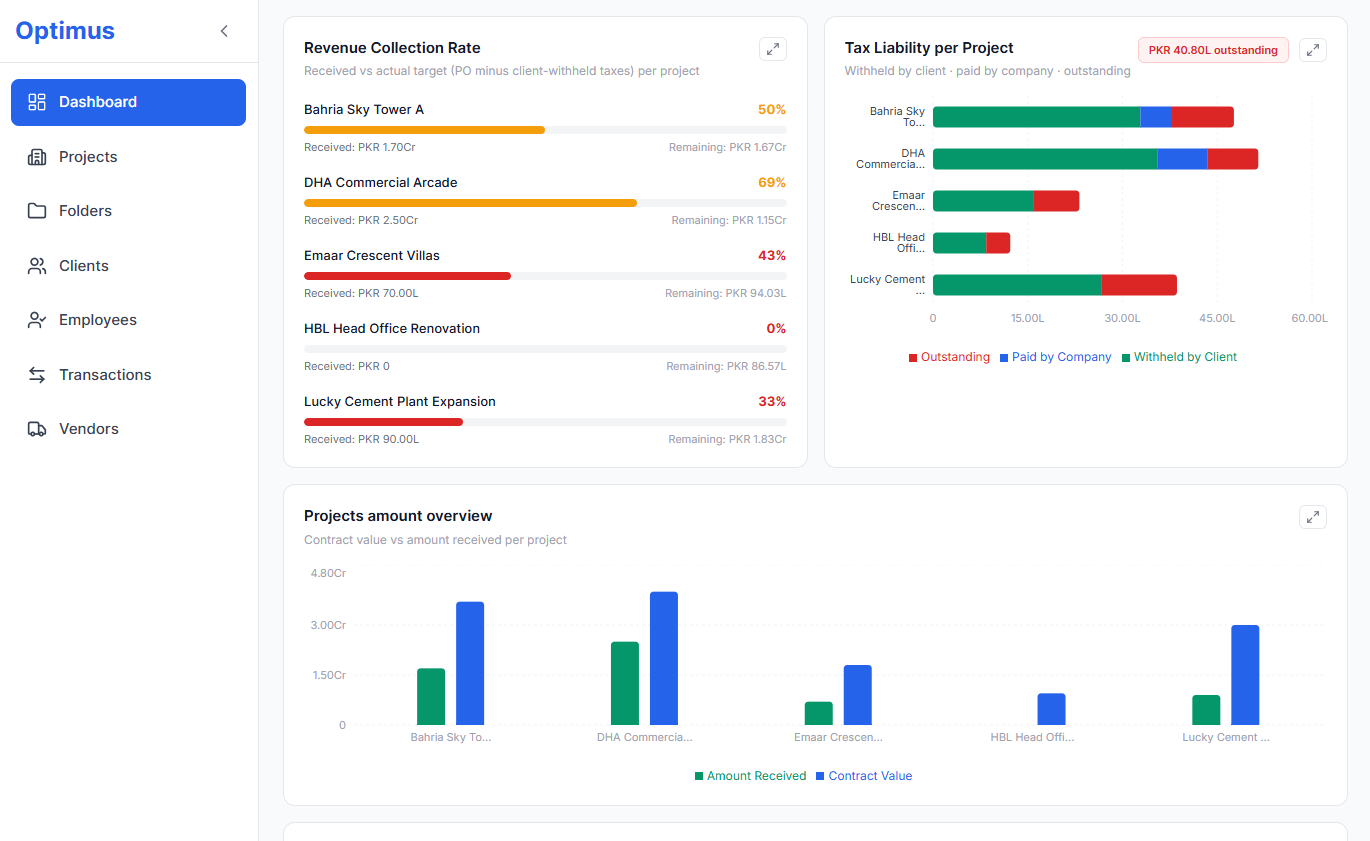
Optimus is an operations platform I built for a construction firm. Projects are billed in cycles against a purchase order, vendors are paid against contracts, materials are bought outside those contracts, and the client withholds part of the tax at source. The dashboard's job is to turn all of that into an estimated profit per project that the owner can trust.
Before calling it done I ran a QA pass over every admin page against the demo seed data. The seed has a reference file with the expected value of every headline figure, worked out by hand, so each number on screen could be checked against something independent.
The tax arithmetic
Most of the risk was here. Each billing cycle stores its PO amount, the income and services tax rates, and how much of each tax the client withholds. Everything else is derived:
servicesTax         = po * servicesRate
incomeTax           = (po + servicesTax) * incomeRate
taxPaidByClient     = incomeTax * incomeWithheld
                    + servicesTax * servicesWithheld
companyTaxLiability = (incomeTax + servicesTax) - taxPaidByClient
actualAmount        = po - taxPaidByClient
These are Mongoose virtuals on the cycle model. One catch: virtuals don't exist in aggregation results. Any figure that comes out of an aggregation pipeline has to re-derive the formula from the raw fields, so the code does that and the project notes say never to trust a virtual from a pipeline.
All of that checked out. Collection rates, tax liability, vendor balances, payroll and inventory matched the reference to the rupee. One thing didn't.
The mismatch
The dashboard showed one project's estimated profit as 2.71 crore. Its own detail page said 2.66 crore. The gap was 480,000, which was exactly that project's material spend.
The detail page computed profit as the amount received, minus contract costs, minus the company's tax liability, minus materials. The dashboard's version had been written first and never got the materials term. Two projects with no material spend matched on both screens, which is why it hadn't been noticed.
Worse, the dashboard had two copies. The per-project health cards used one, and the summary tile at the top derived its own total with the same missing term. Fixing only the first would have left the top tile disagreeing with the cards below it.
The fix
I added the missing term to the per-project calculation, then deleted the summary's copy entirely. The summary now adds up the per-project figures instead of computing its own:
const estimatedProfit = projects.reduce(
  (sum, p) => sum + p.estimatedProfit, 0);
The top tile dropped from 9.42 crore to 9.30 crore, a difference of exactly the company's total material spend. No frontend change was needed, because the dashboard components only render what the API sends.
The pass also turned up two things that looked like bugs and weren't. The vendor list's Given and Remaining columns don't add up to Total, on purpose: Given counts contracts and materials, Remaining counts only what's left on contracts. And an inflow tile shows 0% change when the previous period had no revenue, rather than infinity. The first was confirmed with the client and the second is documented in the code, so both stayed.
The rule I took away is short. A number that appears on two screens comes from one function. If two places compute it, they'll drift, and the first person to notice will be the one reading the dashboard.